
Change color theme
Build and share reports
A report brings selected metrics into one repeatable table. Choose the period, decide what each row represents, and check the actual values before saving. The same saved configuration is used for downloads and scheduled delivery.
Find a report
Open Reports and choose Mine, Shared with you, or Organization. Search by name, filter by category or tags, and choose a card or list layout.
Open a report to review its metrics, period, row groups, filters, and visibility. Choose View report to read its output, or Edit report when you have editing access.
Create a report with a live preview
Choose Create report. The workspace has three sections you can revisit in any order:
- Details. Give the report a recognizable name. Add a description, category, or tags if useful. Choose a PDF template for formatted output. Organization-wide report makes the report visible across your organization; leave it off for a personal report.
- Metrics. Choose Add metrics, search for the metrics you need, select them, and add them to the report. Reorder the selected metrics to set their column order. Use Column label when the report needs a shorter or more specific heading; the underlying metric name stays the same.
- Rows & filters. Choose the reporting period, row groups, and the data to include. Start with a simple configuration, then inspect the preview as you refine it.
On a wide screen, Report preview stays beside the controls. On smaller screens, switch between Configure and Preview. The preview uses real data and updates after you finish changing a control. Wait for Up to date before judging the result. Refresh requests it again.
The preview does not save the report. Choose Save report when its definition is ready. Graphit saves the details, selected metrics, and parameters together, then opens the report output.
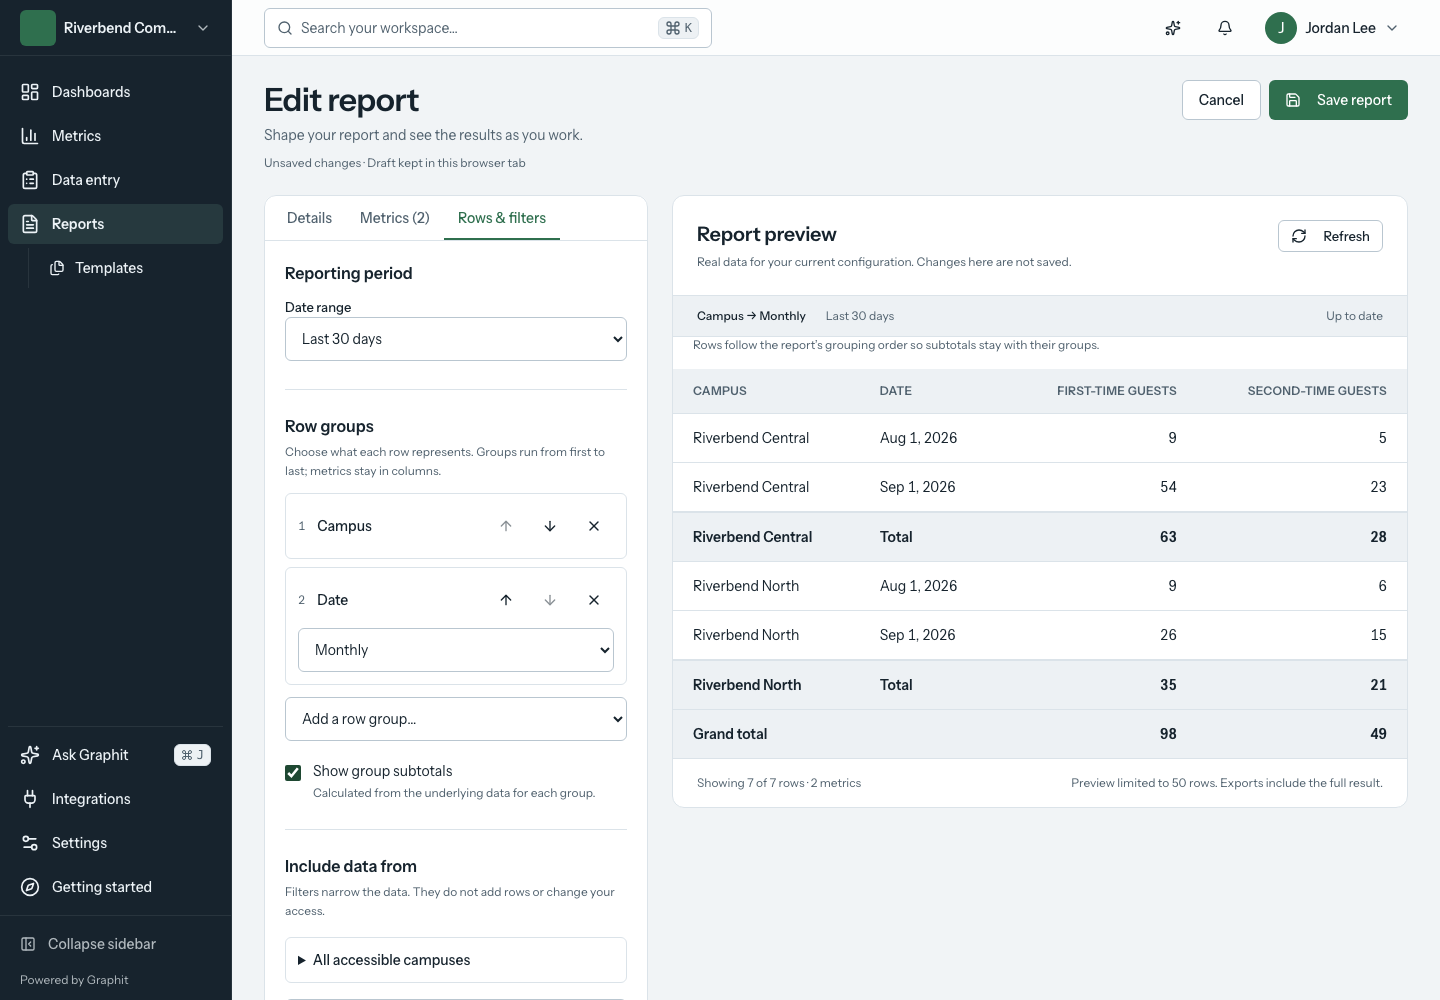
Choose what each row represents
In Rows & filters, use Add row group to add a campus, date, or available partition. A partition is a breakdown such as service time; see the glossary.
| Row groups, in order | What you get |
|---|---|
| No groups | One summary row across the selected period |
| Date, set to Monthly | One row for each month with data |
| Campus, then Date | Each campus's values broken down by the chosen date interval |
| Date, then Service Time | Each period broken down by service time, when that partition is available |
You can select up to four row groups. Use the up and down arrows to change their order, or the remove button to take one out. Metrics remain in columns.
For a Date group, choose Date grouping: daily, weekly, monthly, quarterly, yearly, or ministry year. Date range controls which dates are included; Date grouping controls how those dates become rows. A custom range needs both a start and end date.
With two or more groups, turn on Show group subtotals to include totals at group boundaries and a grand total. These values are calculated from the underlying data. Distinct counts, snapshots, and averages may not equal the sum of the displayed cells.
If a metric does not have a selected partition breakdown, its grouped cells are blank and the preview explains why. Remove that grouping, use compatible metrics, or put that metric in a separate report. A blank cell is not a recorded zero.
Older reports can retain a previous grouping style. If the controls offer Use row groups, select it only when you intend to replace that style, then inspect the new preview before saving.
Filter the data without changing the rows
Under Include data from, expand All accessible campuses and select the campuses to include. Use all campuses clears that selection. Your access still limits the result.
Use Add partition filter to select a breakdown, then select one or more values to keep. For example, choose the Service Time partition and include two specific services. A filter narrows the data; it does not add a column or create separate rows. Add a row group as well when you want those values shown separately.
Select at least one value for each partition filter. Use Remove filter to include all values for that partition again. If the result is empty, check the date range, campuses, and partition selections before changing the metrics.
Continue an unfinished draft
Graphit keeps unfinished changes in the current browser tab, separated by organization and report. If you return to the editor in that tab, Your unfinished draft has been restored confirms that the draft was recovered.
A recovered draft has not been saved to the shared workspace. Choose Save report to keep it. Cancel offers Keep editing or Discard changes when there are unsaved edits; discarding also removes the local draft. Do not rely on this temporary draft to move work to another browser, device, or tab.
If a preview fails, use Retry preview. A previous successful table may remain visible with an explanation; it does not represent the latest configuration until the preview is up to date. If saving fails, the editor keeps the draft so you can correct the issue and try again.
Read and sort the output
The output opens with a bounded preview. Use More report actions → Switch to full report when you need every row. Check the selected period, generation time, and row count before interpreting the numbers. Downloads use the full result, even when the on-screen preview is limited.
For an ordinary table, select a column heading to sort it and select it again to reverse the direction. When subtotals are present, rows stay in the configured group order so each subtotal remains beside its group. A report without row groups shows a single row labelled Total under a Summary column.
If a metric seems missing, open it to inspect its entries and filters. Follow Troubleshooting when the result differs from what you expect.
Export a report
Open Export and choose Export Excel, Export CSV, or Export PDF. A PDF uses the report's template when one is assigned. Otherwise Graphit uses an active template owned by your organization. A system library template must be explicitly selected or copied into the workspace.
When the organization has no template, the PDF uses Graphit's built-in layout: a landscape table titled with the report name, organization, date range, and generation time. Subtotal and total rows are shaded, any report warnings are printed above the table, and a period without data says so instead of showing an empty table.
Sharing access, sending a downloaded result, and making a report organization-wide are different actions. Review the recipient or visibility scope for the action you choose.
Email a report now
Choose Email report from the report's action menu. Add each address under Recipients and press Enter. Add an optional message, choose Attach as Excel (the default), PDF, or Both, then choose Send email.
Graphit confirms how many recipients the report was sent to. If some addresses could not be reached, a separate message lists them; check those addresses before sending again. Each person can send up to 30 report emails an hour. If you reach that limit, the dialog says how long to wait.
Dashboard filters apply only to an Excel attachment. A report sent this way is a one-time email; recipients are not added to any schedule.
Schedule regular delivery
Editors, administrators, and owners can schedule a report when the plan includes scheduled reports. Your plan also limits how many schedules can be active at once.
- Open the report's action menu and choose Manage schedule.
- Choose Create new schedule.
- Choose a Frequency: Daily, Weekly with a Day of week, or Monthly with a Day of month.
- Set the Time and Timezone. The timezone starts as your organization's; everyone receives the report at that time in that timezone.
- Choose the Format: PDF (the default for schedules), Excel, or Both.
- Add the Recipients and, if useful, a Message (optional) that appears in the email above the attached report.
- Choose Create schedule.
Each schedule in Manage schedules shows its recurrence, format, recipients, next send, and Last sent, the time of the last successful delivery. Use Edit schedule to change the time, timezone, frequency, recipients, message, or format. Use Pause schedule and Resume schedule to stop and restart delivery without losing the settings, or Delete schedule to remove it.
The schedule's creator, the report's owner, or an administrator can edit, pause, or delete a schedule. A scheduled report is generated as the person who created the schedule, so recipients see what that person can see, including any restricted metrics they have access to.
When a delivery fails
If a delivery fails, Graphit tries again after 5 minutes, 30 minutes, and 2 hours, never later than the next regular send. If those attempts also fail, it waits for the next scheduled time. The schedule shows Last delivery failed with the reason. A delivery counts as sent when at least one recipient receives it. Editing the schedule clears the failure message.
When a schedule pauses itself
A schedule shows a Paused badge and its reason when Graphit stops sending it. This happens when:
- The person who created it no longer has an account, has been deactivated, has left the organization or is no longer an editor, or can no longer open the report.
- Every recipient has unsubscribed.
To restart delivery, review the recipients and choose Resume schedule. If the creator can no longer send the report, the person who resumes or edits the schedule becomes its sender.
Unsubscribe links
Every scheduled email ends with Unsubscribe from this report. The link works without signing in and applies only to that email address and that schedule. The recipient confirms on the page that opens; other reports they receive are not affected. Many email apps also show their own unsubscribe button for these emails.
Manually emailed reports are one-time messages and do not include an unsubscribe link.
Create a PDF template
Administrators can create and edit the templates used across the workspace. Open Templates from the Reports navigation. Start with a copy from the template library or create a template. System templates stay read-only; edit your own copy.
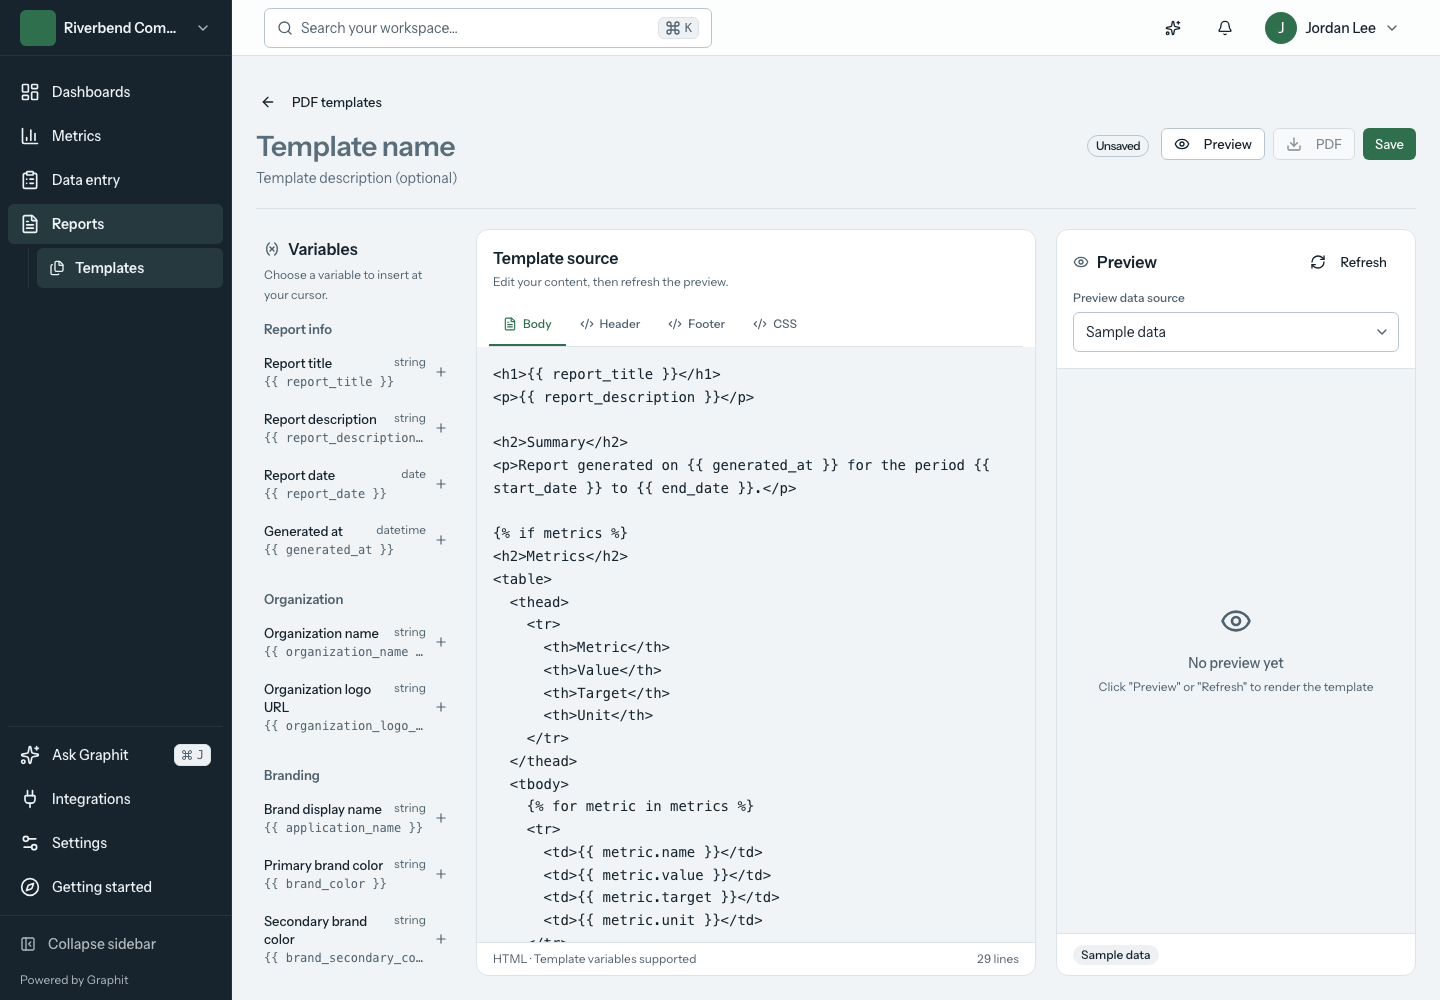
The template editor has three work areas:
- Variables lists the supported report values you can insert.
- Template source separates Body, Header, Footer, and CSS.
- Preview renders the template against its selected data source.
Choose a variable to insert it at the cursor. After editing source, refresh the preview. Check the result before saving or exporting a PDF. Sample preview data is illustrative; select an actual report when you need to verify how the template handles its values.
On smaller screens, use the Variables, Editor, and Preview tabs instead of side-by-side panels.
Keep reports maintainable
Use names that identify an audience or purpose, such as Weekly ministry review. Describe what the report includes and how it should be read. Reuse a template for consistent output, and keep the underlying metrics clearly defined.