
Change color theme
Get started with Graphit
Graphit brings your organization's numbers into one workspace. Start with a single question—such as “How is weekend attendance changing?”—then connect or enter the numbers that answer it.
The examples in these guides use Riverbend Community Church, a fictional organization with sample data.
Understand the four main tasks
| Task | Open | What you do there |
|---|---|---|
| Define a number | Metrics | Choose what to measure, its unit, calculation, and breakdowns. |
| Record values | Data entry | Fill out a form containing one or more metrics. |
| See a pattern | Dashboards | Arrange charts, number tiles, text, and reports. |
| Prepare an output | Reports | Select metrics and a date range, then view, export, or schedule the result. |
A metric defines what a number means. An entry is a recorded value for that metric. A dashboard or report reads those entries; it does not replace them.
Set up your workspace
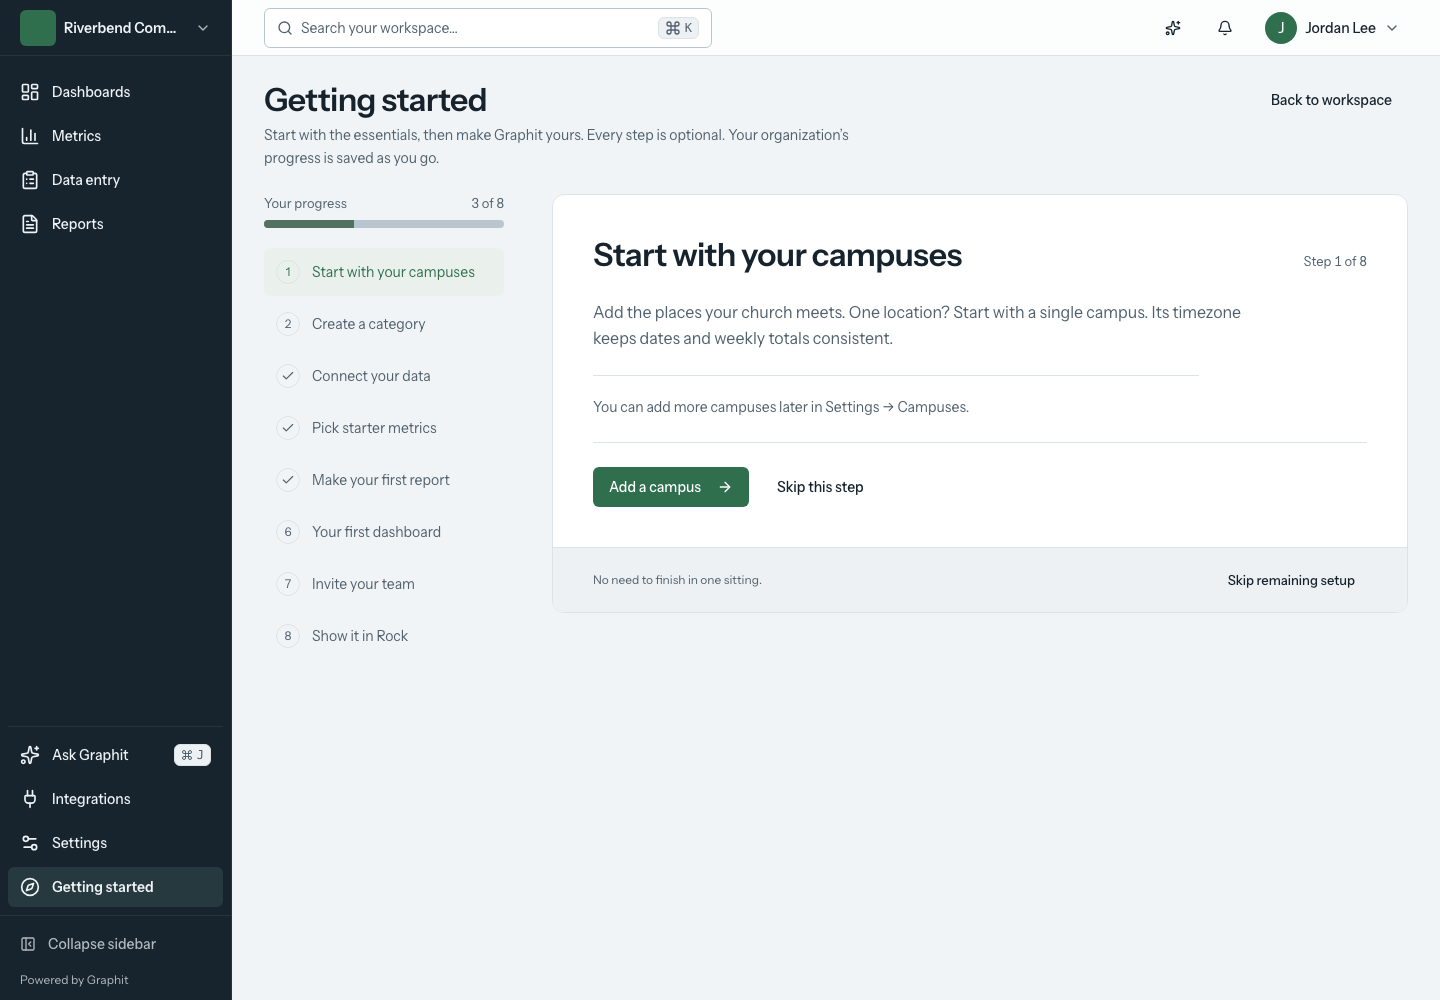
Open Getting started to see your organization's setup checklist. The checklist saves progress as you go, and you can return to it later.
- Start with your campuses. Add the places your organization meets. Check the timezone, especially if you report across locations.
- Create a category. Use recognizable areas such as Attendance, Giving, or Groups to keep related metrics together.
- Connect your data. If you use RockRMS or Planning Center, open Integrations. You can also start with manual entry.
- Pick starter metrics. Define only the measurements you need first.
- Make your first report and your first dashboard to put those numbers to use.
- Invite your team when the workspace is ready for others. Assign access for the work each person needs to do.
You do not need to complete the checklist in one sitting. Back to workspace returns to your dashboards. Skipping a step does not configure that feature for you.
Try a complete manual workflow
- Open Metrics and choose Create metric.
- Name it Weekend attendance, select Count, and use Total when you want recorded values added within each reporting period.
- Choose an attendance category. Leave partitions empty for the simplest first metric.
- Review and create the metric.
- Open Data entry, create a form, and add that metric.
- Open the form, check its date and campus, enter a value, and save.
- Open the metric again to confirm the recorded entry and trend.
- Add the metric to a dashboard or report.
For recurring work, decide who records the number, when it is due, and what the number includes. Put that definition in the metric description so teammates use it consistently.
Choose your next guide
- Find your way around
- Define and manage metrics
- Build and complete data-entry forms
- Create a dashboard
- Build a report
If something is missing
Your role, campus access, and organization plan can affect the controls available to you. Confirm the organization shown in the workspace switcher before changing settings. Ask an owner or administrator when you need access to a task that is not available.