
Change color theme
Define and manage metrics
A metric is a reusable definition of something you measure. Give it a clear name, a unit, and a description that explains what should be counted. The same metric can appear in multiple forms, dashboards, and reports.
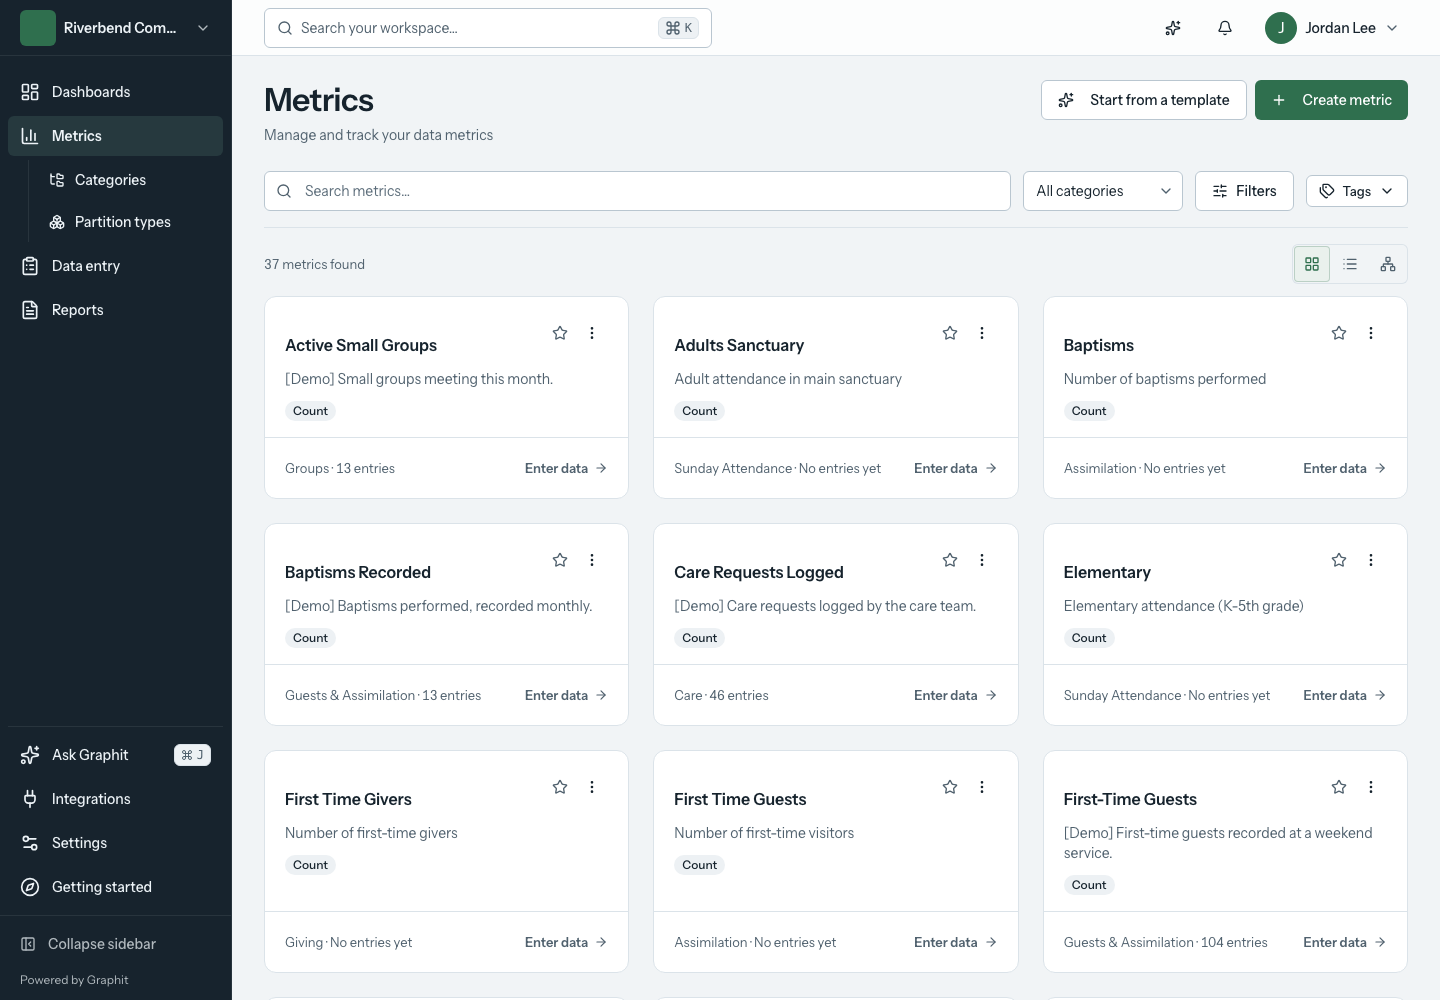
Create a metric
Open Metrics → Create metric. The wizard has four steps:
- Basics. Enter the metric name and description. Choose a unit of measurement and reporting calculation.
- Category. Select a category, create one if needed, or continue without one where offered.
- Partitions. Add optional breakdowns and mark any that must be supplied when entering data.
- Review. Check the definition before creating it.
Choose the unit carefully. The metric editor preserves the metric's type and unit after creation to protect the meaning of its existing entries.
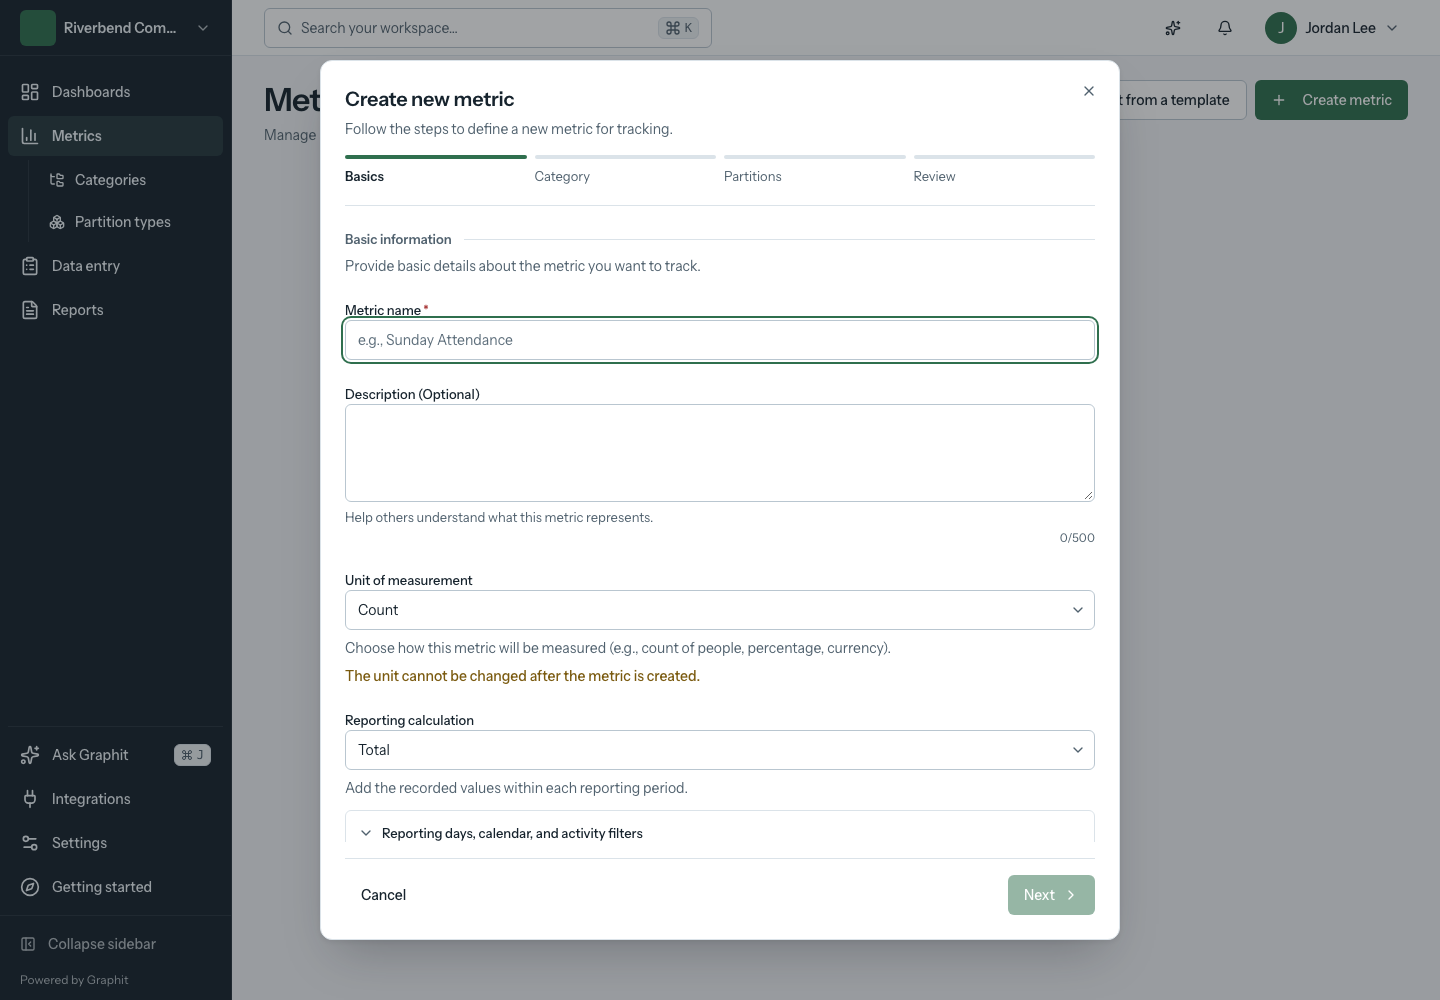
Choose a calculation that matches the question
Total adds the recorded values within a reporting period. Other available calculations may require compatible source activity rather than manually entered totals. Read the explanation shown below the calculation selector before choosing it.
For example, a sum of attendance counts answers “How many attendances were recorded?” It does not automatically answer “How many distinct people attended?” A distinct-person result requires a source that supplies the relevant activity and identity information.
Reporting-day and calendar settings can narrow which days count and define week starts, timezone, and reporting-year boundaries. Keep the calendar consistent across related metrics. Changing an imported activity metric's timezone can require rebuilding its history; use the guidance shown in the editor.
Snapshots that are recalculated in full
Some sources recalculate every row each time they run, such as a count of members in each group. For a Latest value metric like this, turn on Each date is a complete snapshot. Totals then use only the newest date, so a group missing from that date is not carried forward from an older one. Charts plot only the periods that have a snapshot, rather than filling the gaps between them.
Leave the setting off when a source reports only the rows that changed. The setting is removed if you change the metric's calculation.
Use categories and partitions for different purposes
| Concept | Purpose | Example |
|---|---|---|
| Category | Organizes metrics in the workspace | Attendance |
| Partition type | Defines a breakdown recorded with a value | Service time |
| Partition value | One choice within that breakdown | 9:00 AM |
| Campus | Identifies the location associated with an entry | Downtown |
Keep a simple metric unpartitioned when you need only one value per date and campus. Add a partition when the breakdown changes the decisions you can make. Avoid creating separate metrics solely to represent every service or room when one metric with a meaningful breakdown would be easier to maintain.
Review a metric
Open its name in Metrics to see the metric detail page. Use the trend to understand changes and the entries area to inspect the recorded values behind them. Date, campus, and available breakdown filters narrow the results.
An empty result does not always mean the metric has no data. Clear or widen filters before recording another entry.
Delete an entry
Owners and administrators can remove a recorded value. In the metric's Entries table, choose the delete button on the entry's row. Delete this entry? names the value and date; choose Delete to remove it from the metric and from every dashboard and report that uses it.
Delete an entry only when the measurement should not exist, such as a duplicate or a value recorded for the wrong date. When a value is wrong, edit it instead. Entries that come from Rock, a calculation, or an activity source cannot be deleted here; correct them at their source.
Control who can see a metric
Most metrics are visible to everyone in the organization. For confidential numbers, such as staff giving or pastoral care, owners and administrators can limit the audience of a category or an individual metric.
- For a category, open Settings → Categories, edit the category, and set Who can see this category.
- For a metric, open the metric, choose Edit metric, and set Who can see this metric in the Category and organization section.
Choose Restricted to selected roles and people, then select Editors, Viewers, or individual members. Owners and administrators always have access and are not listed. A restricted audience with nobody selected is visible only to owners and administrators.
A lock marks restricted metrics and categories in lists, pickers, and page headers.
How audiences combine
A person sees a metric only when its own audience and the audience of its category, and every parent category, all include them. A metric's audience can narrow its category's audience but never widen it. Restricting a category therefore restricts every metric and subcategory inside it.
A calculated metric that uses a hidden metric is hidden as well. Only owners and administrators can change an audience, or move a metric into or out of a restricted category.
What people outside the audience see
For someone outside the audience, a restricted metric is absent rather than marked forbidden. It does not appear in metric lists, search, favorites, forms, reports, exports, or the assistant, and opening its address shows that it was not found.
| Where | What happens |
|---|---|
| Dashboards | A widget that uses the metric shows Restricted and “You don't have access to this data.” No title or values are loaded. |
| Reports | The metric's column is left out of the preview, output, and downloads. A report whose metrics are all hidden cannot be generated. |
| Forms | The metric's fields are left off the form for that person. |
| Public links and embeds | The content shows what the person who created the link or embed can currently see. Access is checked again on every view. If that person leaves the organization, restricted metrics stop appearing. |
| Scheduled report emails | The report is generated as the person who created the schedule, for every recipient. Review the recipient list before scheduling a report that includes restricted metrics. |
| Weekly briefs | Restricted metrics are always left out, whoever receives the brief. |
Graphit audiences are separate from Rock security. Connecting a Rock metric does not copy Rock's permissions into Graphit; set the audience in Graphit before sharing confidential results.
Edit the definition
Open the metric's edit action. On larger screens, section navigation takes you to Basics, Organization, Breakdowns, Sources, and Advanced. On smaller screens, use the collapsible section headings.
Review changes before saving. Removing or changing a breakdown can affect how existing data is interpreted; use the confirmation and impact information shown by Graphit.
Connect or enter values
- For manual collection, add the metric to a data-entry form.
- For values already maintained in Rock, use Rock setup.
- To present the result, add it to a dashboard or report.